| |

SciPy SpectrogramThe signal processing toolbox consists of few filtering functions, a limited set of filter design tools. It also contains few B-spline interpolation algorithm for one-and two-dimensional data. The scipy.signal.spectrogram computes a spectrogram with the consecutive Fourier transforms. Spectrograms can be used as a way of reflecting the change of frequency content of non-signal signals over time. Output: 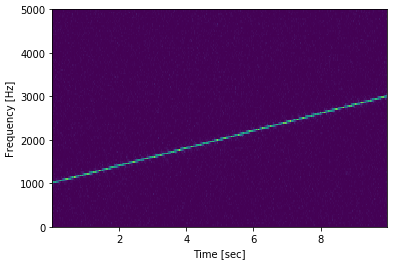
The scipy.signal.spectogram() returns the following array: f: ndarray Array of sample frequencies. t: ndarray Array of segment times. Sxx: ndarry Spectogram of x. By default the last axis of Sxx corresponds to the segment times
Next Topic#
|
 For Videos Join Our Youtube Channel: Join Now
Feedback
- Send your Feedback to [email protected]
Help Others, Please Share


Javatpoint Services
JavaTpoint offers too many high quality services. Mail us on [email protected], to get more information about given services.
- Website Designing
- Website Development
- Java Development
- PHP Development
- WordPress
- Graphic Designing
- Logo
- Digital Marketing
- On Page and Off Page SEO
- PPC
- Content Development
- Corporate Training
- Classroom and Online Training
- Data Entry
Training For College Campus
JavaTpoint offers college campus training on Core Java, Advance Java, .Net, Android, Hadoop, PHP, Web Technology and Python. Please mail your requirement at [email protected]
Duration: 1 week to 2 week


