| |

UML Timing DiagramIn UML, the timing diagrams are a part of Interaction diagrams that do not incorporate similar notations as that of sequence and collaboration diagram. It consists of a graph or waveform that depicts the state of a lifeline at a specific point of time. It illustrates how conditions are altered both inside and between lifelines alongside linear time axis. The timing diagram describes how an object underwent a change from one form to another. A waveform portrays the flow among the software programs at several instances of time. Following are some important key points of a timing diagram:
Basic concepts of a Timing DiagramIn UML, the timing diagram constitutes several major elements, which are as follows: Lifeline As the name suggests, the lifeline portrays an individual element in the interaction. It represents a single entity, which is a part of the interaction. It is represented by the classifier's name that it depicts. A lifeline can be placed within a "swimlane" or a diagram frame. 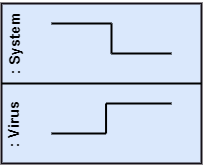
Lifelines representing instances of a System and Virus State or Condition Timeline The timing diagram represents the state of a classifier or attributes that are participating, or some testable conditions, which is a discrete value of the classifier. In UML, the state or condition is continuous. It is mainly used to show the temperature and density where the entities endure a continuous state change. 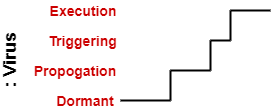
Timeline showing the change in the state of virus between dormant, Propagation, Triggering, Execution Duration Constraint The duration constraint is a constraint of an interval, which refers to duration interval. It is used to determine if the constraint is satisfied for a duration or not. The duration constraint semantics inherits from the constraints. The negative trace defines the violated constraints, which means the system is failed. A graphical association between duration interval and the construct, which it constrains, may represent a duration constraint. 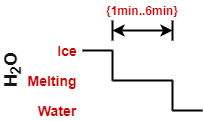
Ice should melt into the water in 1 to 6 mins. Time Constraint It is an interval constraint, which refers to the time interval. Since it is a time expression, it depicts if the constraint is satisfied or not. The constraints dispense its time constraints semantics. The negative trace defines the violated constraints, which means the system is failed. The time constraint is represented by a graphical association between the time interval and the construct which it constrains. The graphical association is mainly represented by a small line in between a time interval and an occurrence specification. 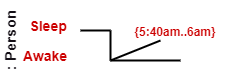
A person should wakeup in between 5:40 am, and 6 am Destruction Occurrence The destruction occurrence refers to the occurrence of a message that represents the destruction of an instance is defined by a lifeline. It may subsequently destruct other objects owned by the composition of this object, such that nothing occurs after the destruction event on a given lifeline. It is represented by a cross at the end of a timeline. 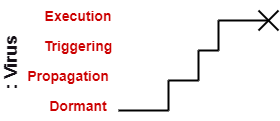
Virus lifeline is terminated Example of a Timing DiagramA timing diagram example of a medical domain that depicts different stages of Alzheimer's disease (AD) is explained below. Since Alzheimer's is a very progressive fatal brain disease, it leads to memory loss and intellectual abilities. The reason behind this disease is yet to be discovered. It cannot be cured as well as one of the main reasons for rising death rates in the United States. The doctor may require a diagnostic framework with three to seven-stage, such that its evolution may last for about 8 to 10 years. Also, in some cases, it lasts up to 20years from the time neuron starts changing. The example given below constitutes timing for a seven-stage framework. The given example is just a UML diagram and should not be considered as a reference to medical research. The medical details are provided for you to better understand the UML diagram. 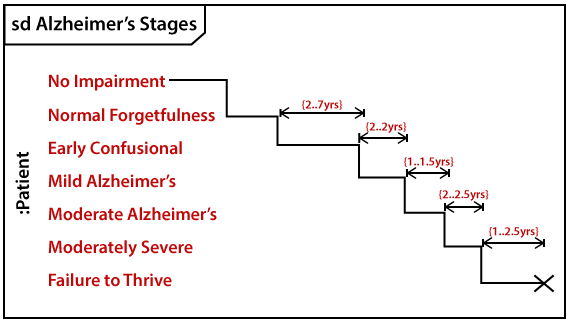
Following are the seven-stage Alzheimer disease framework explained below:
Benefits of Timing Diagram
Drawbacks of Timing Diagram
Next TopicUML Tools
|
 For Videos Join Our Youtube Channel: Join Now
Feedback
- Send your Feedback to [email protected]
Help Others, Please Share


Javatpoint Services
JavaTpoint offers too many high quality services. Mail us on [email protected], to get more information about given services.
- Website Designing
- Website Development
- Java Development
- PHP Development
- WordPress
- Graphic Designing
- Logo
- Digital Marketing
- On Page and Off Page SEO
- PPC
- Content Development
- Corporate Training
- Classroom and Online Training
- Data Entry
Training For College Campus
JavaTpoint offers college campus training on Core Java, Advance Java, .Net, Android, Hadoop, PHP, Web Technology and Python. Please mail your requirement at [email protected]
Duration: 1 week to 2 week


