| |

Binomial DistributionThe binomial distribution is also known as discrete probability distribution, which is used to find the probability of success of an event. The event has only two possible outcomes in a series of experiments. The tossing of the coin is the best example of the binomial distribution. When a coin is tossed, it gives either a head or a tail. The probability of finding exactly three heads in repeatedly tossing the coin ten times is approximate during the binomial distribution. R allows us to create binomial distribution by providing the following function: 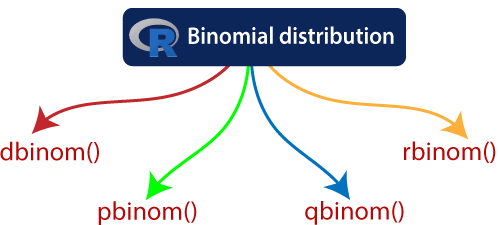
These function can have the following parameters:
Let's start understanding how these functions are used with the help of the examples dbinom(): Direct Look-Up, PointsThe dbinom() function of R calculates the probability density distribution at each point. In simple words, it calculates the density function of the particular binomial distribution. Example Output: 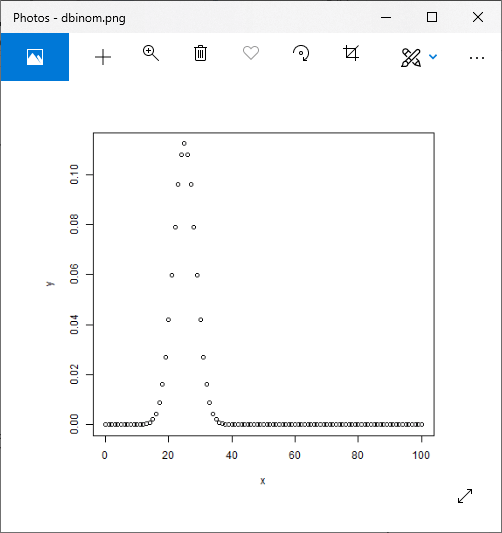
pbinom():Direct Look-Up, IntervalsThe dbinom() function of R calculates the cumulative probability(a single value representing the probability) of an event. In simple words, it calculates the cumulative distribution function of the particular binomial distribution. Example Output: 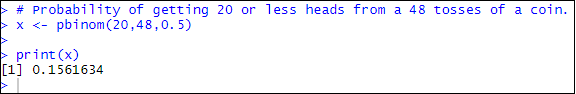
qbinom(): Inverse Look-UpThe qbinom() function of R takes the probability value and generates a number whose cumulative value matches with the probability value. In simple words, it calculates the inverse cumulative distribution function of the binomial distribution. Let's find the number of heads that have a probability of 0.45 when a coin is tossed 51 times. Example Output: 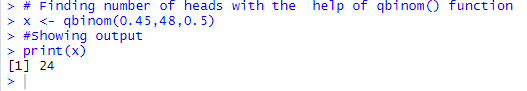
rbinom()The rbinom() function of R is used to generate required number of random values for given probability from a given sample. Let's see an example in which we find nine random values from a sample of 160 with a probability of 0.5. Example Output: 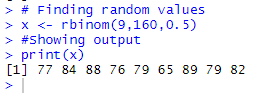
Next TopicR Classification
|
 For Videos Join Our Youtube Channel: Join Now
Feedback
- Send your Feedback to [email protected]
Help Others, Please Share


Javatpoint Services
JavaTpoint offers too many high quality services. Mail us on [email protected], to get more information about given services.
- Website Designing
- Website Development
- Java Development
- PHP Development
- WordPress
- Graphic Designing
- Logo
- Digital Marketing
- On Page and Off Page SEO
- PPC
- Content Development
- Corporate Training
- Classroom and Online Training
- Data Entry
Training For College Campus
JavaTpoint offers college campus training on Core Java, Advance Java, .Net, Android, Hadoop, PHP, Web Technology and Python. Please mail your requirement at [email protected]
Duration: 1 week to 2 week


