| |

Splunk- Transforming CommandsThe search must transform the event data into statistical data tables to create visualizations of the charts. These statistical tables are required for visualization of charts and other kinds of data. In this section, we will explain how to use transform commands to extract data from events. It will provide a piece of brief information on transforming commands and searches for more information about transforming commands and their role in creating statistical tables and chart visualizations. TransformingA transforming command commands the results of the search to a table of data. Such commands "transform" the specified cell values for each event into numerical values, which can be used for statistical purposes by Splunk software. Transforming commands are also necessary to transform the search result data into the data structures required for visualizations such as column, bar, line, area, and pie charts. If used to measure column totals (not row totals), transforming commands include a map, timecart, details, top, uncommon, and addtotals. Our search must transform the event data into statistical data tables to create visualizations of the charts. These statistical tables are needed for visualization of charts and other kinds of data. Here we will learn how to use the transform commands to extract data from events. This Splunk tutorial explains the major transforming command categories and offers examples of how they can be used in a search. Transforming commandsThe primary transforming commands are:
Note: We always place our transforming commands after our search commands, linking them to a pipe operator.The commands Chart, Timechart, and Stats are all intended to work with statistical functions. The list of statistical functions available are:
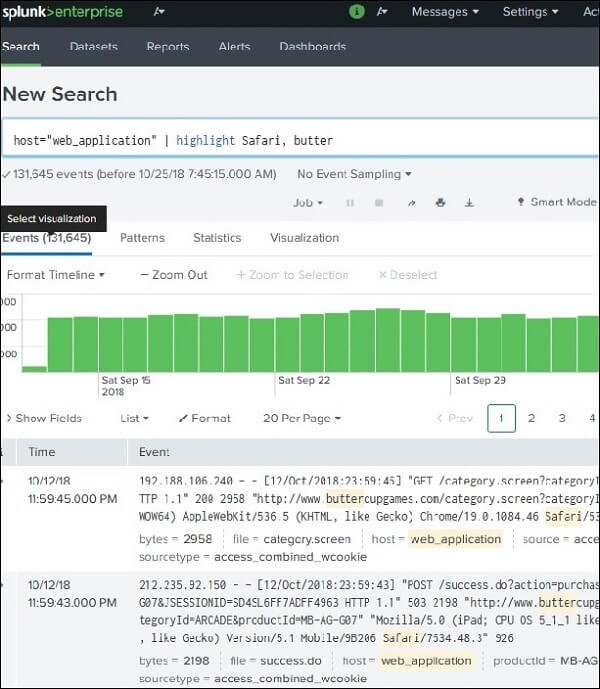
Some statistical functions only work with the timechart command. Note: All searches create different data structures with transforming commands. The different chart forms allow these data structures to be set up in particular ways. For example, not all searches will enable us to generate bar, column, line, and area charts. They are automatically chosen as per the need of the data. The charts are selected in which it can be best represented.We can use real-time search to measure metrics on large incoming data flows in real-time, without using summary indexing. However, our report on a live and continuous data stream will update the timeline as the events come in, and we can only display the table or map in preview mode. Certain search commands will also be more applicable for real-time use. HighlightThis command is used to highlight particular words in the result set of searches. It is used by providing a highlight feature with the search terms as arguments. Separating them with a comma provides several search words. In the example below, we look at the result set for terms, safari, and butter. NOTE
|
 For Videos Join Our Youtube Channel: Join Now
Feedback
- Send your Feedback to [email protected]
Help Others, Please Share


Javatpoint Services
JavaTpoint offers too many high quality services. Mail us on [email protected], to get more information about given services.
- Website Designing
- Website Development
- Java Development
- PHP Development
- WordPress
- Graphic Designing
- Logo
- Digital Marketing
- On Page and Off Page SEO
- PPC
- Content Development
- Corporate Training
- Classroom and Online Training
- Data Entry
Training For College Campus
JavaTpoint offers college campus training on Core Java, Advance Java, .Net, Android, Hadoop, PHP, Web Technology and Python. Please mail your requirement at [email protected]
Duration: 1 week to 2 week


