| |

MATLAB stem3()Three-dimensional stem plots shows lines extending from the xy-plane. A circle (the default) or other marker symbols whose z-position describes the data value terminates each stem. SyntaxExampleCreate a three-dimensional stem plot to visualize the function of two variables. Output: 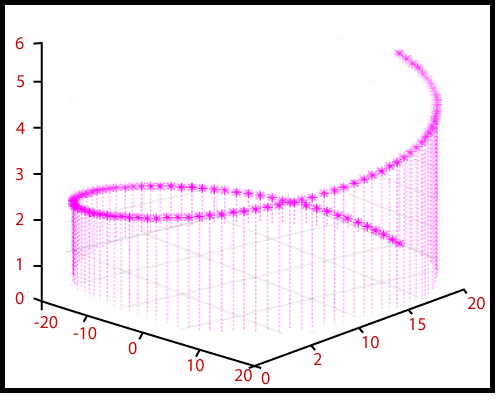
Next TopicMATLAB ribbon()
|
 For Videos Join Our Youtube Channel: Join Now
Feedback
- Send your Feedback to [email protected]
Help Others, Please Share


Javatpoint Services
JavaTpoint offers too many high quality services. Mail us on [email protected], to get more information about given services.
- Website Designing
- Website Development
- Java Development
- PHP Development
- WordPress
- Graphic Designing
- Logo
- Digital Marketing
- On Page and Off Page SEO
- PPC
- Content Development
- Corporate Training
- Classroom and Online Training
- Data Entry
Training For College Campus
JavaTpoint offers college campus training on Core Java, Advance Java, .Net, Android, Hadoop, PHP, Web Technology and Python. Please mail your requirement at [email protected]
Duration: 1 week to 2 week
Like/Subscribe us for latest updates or newsletter 


